The £562 Billion Energy Reckoning: We Paid More, We Built More—and 53% of Our Emissions Footprint Is Oversea
Britain’s energy transformation was not imposed by one politician or one political party. It was constructed in stages, under successive Labour, Coalition and Conservative governments, before being accelerated again by the present Labour administration.
Each government inherited the framework, accepted its underlying assumptions and added another layer of targets, subsidies, contracts or regulation.
The central mechanism linking them all is the Climate Change Act 2008: legislation that converted a political ambition into a legally binding, multi-decade programme affecting electricity, heating, transport, industry, agriculture, housing and finance.
Seventeen years later, Britain has invested hundreds of billions of pounds, household electricity prices have doubled, standing charges have more than tripled and 53% of the emissions associated with UK consumption occur overseas.
This is not an accusation against one person.
It is an examination of the Act, the system built around it and the consequences no government has yet brought together in one transparent public account.
2002–2003: Blair Establishes the DirectionThe process began before the Climate Change Act itself.
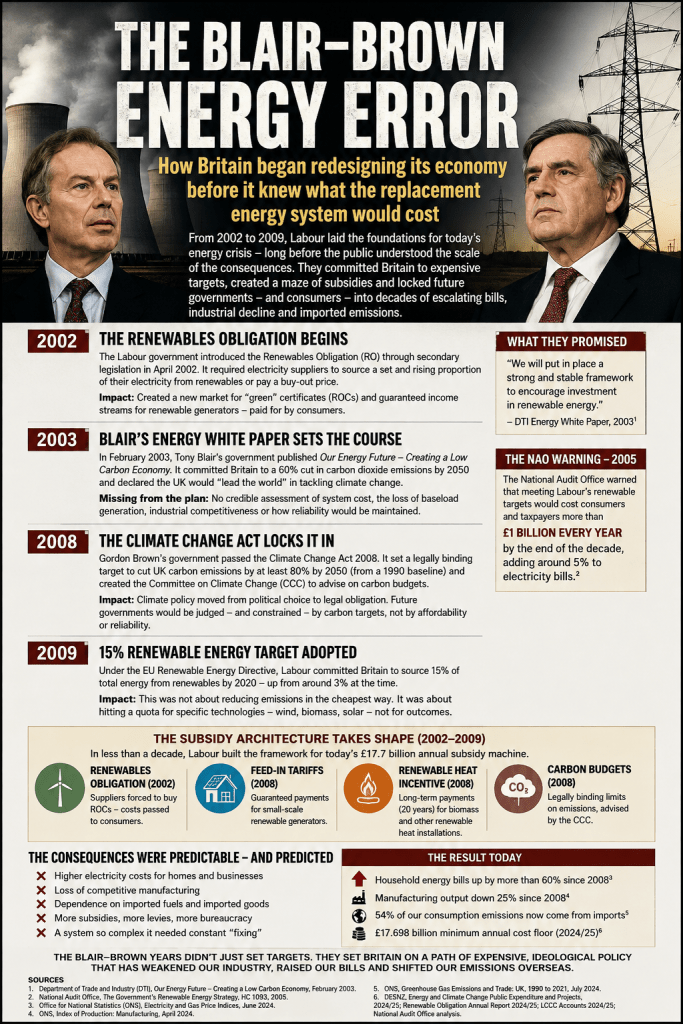
In 2002, Tony Blair’s government introduced the Renewables Obligation, requiring electricity suppliers to obtain an increasing proportion of their power from eligible renewable generators or make compensating payments.
This created a market for renewable certificates and placed the cost within the electricity system, ultimately to be recovered from consumers.
Blair’s 2003 Energy White Paper then established the political direction, proposing a 60% reduction in carbon-dioxide emissions by 2050 while promising reliable supplies, competitive markets and affordable energy.
The destination had been declared, but the eventual scale of electricity-network expansion, backup capacity, subsidy commitments, industrial displacement and consumer exposure had not been comprehensively costed.
The crucial assumption was that Britain could redesign its energy system while preserving affordability and security.
That proposition would subsequently be repeated by every government, even as the mechanisms required to deliver it became larger and more expensive.
2007–2009: Brown Turns an Ambition into Law
The draft Climate Change Bill was published under Blair in 2007, but Gordon Brown’s government carried the legislation into law.
The “Climate Change Act 2008” (https://www.legislation.gov.uk/ukpga/2008/27/contents) established a legally binding target to reduce UK greenhouse-gas emissions by at least 80% from their 1990 level by 2050.
It created five-year carbon budgets and established the Climate Change Committee to recommend the trajectory and assess governments’ performance.
Ed Miliband, appointed Energy and Climate Change Secretary in October 2008, oversaw the Act’s final passage. In 2009, the UK also accepted an obligation to obtain 15% of all energy—not merely electricity—from renewable sources by 2020.
These decisions transformed climate policy.
A future government could still choose the details, but it could no longer easily reconsider the destination.
Targets would drive policy;
policy would drive investment;
investment would require subsidies, contracts, networks and regulated returns.
What began as an aspiration had become a statutory ratchet.
2010–2015: Cameron Builds the Commercial Machinery
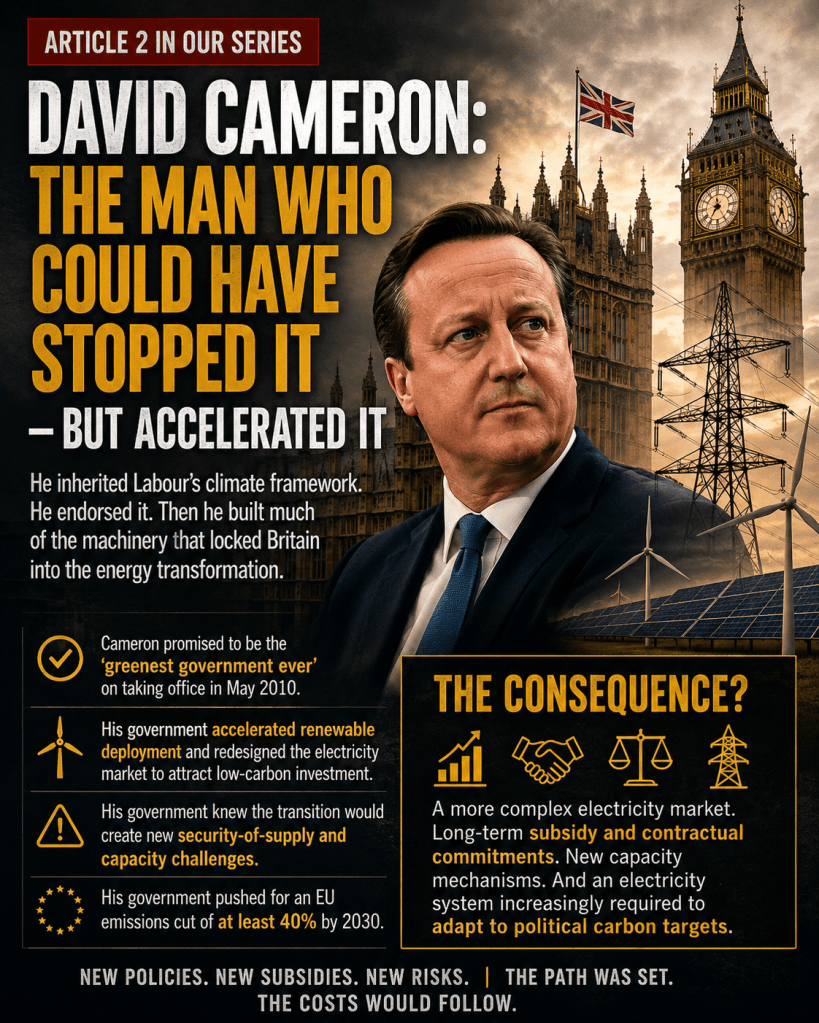
David Cameron entered office promising the “greenest government ever.” Rather than dismantling Labour’s framework, the Coalition government made it commercially enforceable. The “Energy Act 2013” (https://www.legislation.gov.uk/ukpga/2013/32/contents) introduced Electricity Market Reform, including Contracts for Difference to guarantee qualifying generators a long-term strike price and the Capacity Market to pay providers for maintaining dispatchable capacity.
The logic was revealing:
increasing renewable generation required guaranteed revenue to attract investment, while maintaining reliability required a separate mechanism to pay for capacity capable of operating when supply was tight.
Consumers would therefore support new low-carbon generation while also helping finance the capacity needed behind it.
Cameron did not merely inherit the Climate Change Act;
his government built much of the contractual machinery that converted its targets into decades-long financial commitments. The transformation ceased to be only a government programme and became an investable market underwritten by policy.
2015–2019:
The Framework Moves into Finance—and May Raises the Target
The next phase extended climate enforcement beyond energy departments. As Governor of the Bank of England and chairman of the Financial Stability Board, Mark Carney argued that climate change presented material financial risks and promoted corporate disclosure of exposure to the transition.
The Task Force on Climate-related Financial Disclosures was established in 2015, helping make climate assumptions increasingly important to lending, investment, insurance and corporate planning.
Theresa May then made the largest legal escalation since 2008. In 2019, her government amended the Climate Change Act’s 2050 target from an 80% reduction to a “100% reduction—Net Zero” (https://www.legislation.gov.uk/ukdsi/2019/9780111187654).
A profound national commitment, covering almost the entire economy for the following three decades, was made through secondary legislation.
Parliament had not been given a consolidated account of the capital investment, consumer costs, network expansion, industrial consequences or imported emissions that would accompany it.
2019–2024: Johnson Accelerates and Sunak Preserves the Framework
Boris Johnson converted Net Zero into a programme of visible national transformation.
His government’s “Ten Point Plan” (https://www.gov.uk/government/publications/the-ten-point-plan-for-a-green-industrial-revolution)
promoted offshore wind, nuclear power, hydrogen, electric vehicles, heat pumps, carbon capture and greener buildings. It committed the UK internationally to cutting territorial emissions by at least 68% by 2030 and published the 2021 Net Zero Strategy setting out sector-by-sector policies.
Rishi Sunak later delayed or softened several individual deadlines, but he did not repeal Net Zero, alter the carbon-budget system or dismantle the subsidy and contractual architecture.
This distinction matters.
Governments may change the speed or presentation of individual policies, but the statutory destination remains in place. Once targets, contracts, infrastructure plans and investor expectations have accumulated, the political and financial cost of changing direction grows progressively larger.
2024–2026: Miliband Returns—and Carbon Budget Seven Extends the Ratchet
Ed Miliband returned to the energy department in 2024, sixteen years after overseeing the final passage of the original Act. The Government’s “Clean Power 2030 plan” (https://www.gov.uk/government/publications/clean-power-2030-action-plan)
calls for a rapid expansion of renewable generation, storage, transmission infrastructure and system flexibility.
Its technical annex estimates approximately £40 billion of investment annually between 2025 and 2030—around £30 billion for generation and £10 billion for transmission. On 2 June 2026, Miliband’s department announced the Seventh Carbon Budget, subsequently set at 535 million tonnes of CO₂ equivalent for 2038–2042, approximately “87% below the 1990 level” (https://www.gov.uk/government/news/energy-security-jobs-and-investment-boost-through-climate-action).
Carbon Budget Seven is not merely another electricity target.
It sends a statutory signal across transport, heating, industry, farming, aviation and the wider economy.
Nearly two decades after the original Act, the same minister was helping extend its consequences into the 2040s.
The Consequence: £215 Billion Already Invested in Physical Energy Assets
The consequences begin with capital investment. Between 2008 and 2024, the UK electricity, gas, steam and air-conditioning industry recorded £182.179 billion in buildings, structures and associated transfer costs, together with £32.952 billion in machinery and equipment. That represents £215.131 billion of investment in these physical asset categories.
A further £21.210 billion was recorded as intellectual-property investment, taking total gross fixed capital formation in the energy-supply industry to £236.341 billion.
These are not campaign estimates: they come from the “Office for National Statistics’ Blue Book investment data” (https://www.ons.gov.uk/economy/grossdomesticproductgdp/datasets/annualgrossfixedcapitalformationbyindustryandasset/current).
In 2024 alone, the industry recorded £23.723 billion of capital formation , almost 40% more in cash terms than in 2023 , including £17.977 billion in structures, £4.220 billion in machinery and £1.526 billion in intellectual property.
Britain has unquestionably built more.
The unanswered question is whether consumers have received affordability, resilience and national economic value proportionate to the investment.
The Next Consequence: Another £240 Billion by 2030
The expenditure already recorded is only the beginning. The “Clean Power 2030 technical annex” (https://www.gov.uk/government/publications/clean-power-2030-action-plan/clean-power-2030-action-plan-a-new-era-of-clean-electricity-technical-annex) estimates that approximately £40 billion of investment could be required every year from 2025 to 2030.
Over six years, that represents roughly £240 billion more. The estimate is in 2024 prices, undiscounted, rounded to the nearest £10 billion and excludes financing and operating costs.
It also explicitly includes imported equipment and other overseas inputs.
Ministers may describe much of this as private investment, but private capital is not free money.
Investors require contracts, regulated returns and reliable future revenues. Those revenues are ultimately supported through electricity bills, network charges, taxation, subsidy arrangements or government-backed agreements.
The public may not write the construction cheque directly, but it finances the commercial system that makes the investment viable.
The Continuing Consequence: At Least £17.8 Billion a Year in Support
Alongside investment sits a complex structure of renewable, capacity, heating and household-energy support. The identifiable annual total is approximately £17.8 billion:
£7.703 billion through the Renewables Obligation, £1.826 billion through Feed-in Tariffs, £2.198 billion through Contracts for Difference, £1.209 billion through the Renewable Heat Incentive, £1.246 billion through the Capacity Market, £1.686 billion through the Energy Company Obligation, £206 million through the Great British Insulation Scheme, £17 million through Green Gas Support and £1.711 billion in other DESNZ grants.
If approximately that level continued for another six years, it would represent around £106.8 billion in further financial flows. The schemes perform different functions, and some support can finance assets already appearing in investment statistics, but together they demonstrate the scale of the policy architecture created to deliver the statutory targets.
The £561.9 Billion Reckoning
Mechanically combining £215.1 billion of physical energy investment recorded between 2008 and 2024, approximately £240 billion of projected Clean Power investment between 2025 and 2030 and £106.8 billion representing six further years of identified support produces an illustrative gross-flow total of approximately £561.9 billion.
This is not a calculation of net economic cost. It combines historical cash expenditure with a projection expressed in 2024 prices; the ONS figures include conventional as well as transition-related assets; and subsidies may overlap with capital formation. But these qualifications do not render the calculation meaningless.
They reveal the opposite problem:
after seventeen years of legally driven policy, no government department publishes one consolidated account showing investment, subsidies, financing costs, regulated returns, network expenditure, backup capacity, balancing interventions, constraint payments, taxation and consumer charges together.
The public should not have to reconstruct a half-trillion-pound financial framework from separate accounts and datasets.
The Household Consequence:
We Paid More
While governments celebrated rising investment, consumers experienced rising bills. In 2013, the electricity rate used for this comparison was 12.98p per kilowatt-hour and the standing charge was 17.39p per day. During the Ofgem price-cap period from July to September 2026, the average Direct Debit electricity rate is 26.11p per kilowatt-hour and the standing charge is 57.19p per day.
The unit price has therefore risen by 101.2%, while the daily standing charge has risen by 228.9%. At identical annual consumption of 3,600 kWh of electricity and 13,600 kWh of gas, the calculated electricity bill rises from £530.63 to £1,148.70, while the combined gas-and-electricity bill rises from £1,175.02 to £2,251.58—an increase of 91.6%.
These are fixed-consumption comparisons using “Ofgem’s published rates” (https://www.ofgem.gov.uk/information-consumers/energy-advice-households/energy-price-cap-unit-rates-and-standing-charges) and historical “government energy-price data” (https://www.gov.uk/government/statistical-data-sets/annual-domestic-energy-price-statistics), not Ofgem’s lower current typical-consumption measure.It would be dishonest to attribute every increase to Net Zero. The international wholesale gas crisis caused the exceptional 2022–23 surge, and wholesale energy remains an important part of bills. It would be equally dishonest, however, to pretend that policy choices impose no continuing costs. Renewable support, transmission expansion, local-network reinforcement, backup generation, balancing interventions, capacity payments and system-management requirements form a lasting financial layer. Consumers feel that layer most clearly through the standing charge—the part of the electricity bill they cannot avoid by reducing their consumption.
The Industrial Consequence:
Britain’s Emissions Moved Overseas
Britain’s territorial emissions have fallen substantially, and that achievement should be acknowledged. Territorial accounting, however, records emissions produced inside the country; it does not fully capture emissions caused by British consumption. According to “Defra’s UK carbon-footprint statistics” (https://www.gov.uk/government/statistics/uks-carbon-footprint/carbon-footprint-for-the-uk-and-england-to-2023),
the UK’s consumption-based greenhouse-gas footprint was 699 million tonnes of CO₂ equivalent in 2023. Of this, 371 million tonnes arose from imported goods and services—53% of the entire footprint. Since 1996, territorial emissions have fallen by 50%, but the consumption footprint has fallen by only 15%, while emissions embedded in imports have increased by 43%.
China alone accounted for 93 million tonnes of the emissions embedded in UK imports in 2023, equivalent to 13% of the country’s entire consumption footprint.
This does not prove that every factory closed because of climate policy, nor that every imported product displaced British production.
It does establish that Britain has cleaned its domestic emissions account far more rapidly than it has reduced the emissions associated with what it consumes. When production moves overseas and Britain imports the resulting steel, machinery, batteries, solar panels and manufactured goods, the emissions do not disappear.
The chimney may vanish from Yorkshire, the Midlands or South Wales, but production and pollution can reappear in another jurisdiction.
Britain’s territorial account looks cleaner; the atmosphere does not recognise accounting boundaries.
Carbon Budget Seven and the Future Trillion-Pound Commitment
The £561.9 billion figure reaches only to 2030, while Carbon Budget Seven extends the legally driven transformation to 2042 and Net Zero continues to 2050.
The Climate Change Committee estimates that its Seventh Carbon Budget pathway requires average additional investment of approximately £26 billion a year between 2025 and 2050. Multiplied across the period, that is roughly £676 billion of additional investment, although it overlaps with Clean Power 2030 and must not simply be added to the £561.9 billion calculation. The responsible conclusion is therefore not that Britain has received one precise trillion-pound invoice. It is that the gross transformation created by the Climate Change Act has unmistakably entered trillion-pound territory once historic investment, future generation, national networks, transport, heating, industrial conversion and continuing support are considered across the full period.
Official models offset much of that investment against projected operating savings, avoided fossil-fuel expenditure and wider benefits. Those forecasts should be published and tested, but projected savings should not make gross expenditure disappear from public scrutiny before it has occurred. This reckoning does not depend on carbon offsets, nor does it assume that every pound invested is a loss.
It asks a more basic question:
what must Britain build, finance and maintain; who ultimately pays; which savings actually materialise; and how much genuine global emissions reduction is achieved once imported emissions are counted?
The Climate Change Act Must Now Face a Full Audit
The Climate Change Act has survived Labour, Coalition and Conservative governments because every administration has accepted its central architecture.
Blair established the direction. Brown made it legally binding. Cameron built the commercial machinery. May converted an 80% target into Net Zero. Johnson accelerated implementation. Sunak adjusted deadlines without dismantling the framework. Starmer and Miliband have now added Clean Power 2030 and Carbon Budget Seven.
Responsibility is therefore institutional and cross-party.
The question is no longer who started it, but why no government has produced a comprehensive, independently audited account of its consequences.
That audit must show all capital investment since 2008; renewable and low-carbon support; transmission and distribution expenditure; backup, balancing and constraint costs; financing obligations and regulated returns; taxation and consumer levies; imported equipment; decommissioning and waste liabilities; household and industrial price effects; industrial displacement; and the emissions embedded in imported goods and infrastructure.
Its purpose would not be to declare every renewable project worthless or every pound wasted. It would determine whether the transformation has delivered value.
After hundreds of billions of pounds, households should not be paying twice the electricity unit rate and more than three times the standing charge without a transparent account of where the money went.
Britain should not congratulate itself solely on territorial emissions reductions when 53% of its consumption footprint is generated overseas.
And Parliament should not extend legally binding commitments towards a trillion-pound national transformation without demonstrating how affordability, reliability, industrial sovereignty and genuine global emissions reduction will be protected.
The final test of the Climate Change Act cannot be whether governments comply with targets created by the Act itself.
It must be whether the system it produced delivers affordable and reliable energy, strengthens rather than exports British industry, and reduces emissions in the atmosphere rather than merely moving them beyond Britain’s borders.
On the evidence presently available, that case has not yet been proved.


Shane Oxer. Campaigner for fairer and affordable energy
 SAY NO TO THE DESTRUCTION OF OUR LAND
Leave a comment