Energy bills are rising again. Food prices remain almost 40% above January 2021. Household energy debt exceeds £4.5 billion. For millions of families, the crisis is no longer hidden in forecasts—it is visible in every weekly budget.
Winter 2026–27 will not be defined only by the temperature. It will be defined by how many households discover that Britain has allowed heating the home and feeding the family to become competing demands.
There has rarely been a more visible collision between energy policy, food security and household affordability.
The energy price cap will rise by another 4% on 1 October. A typical dual-fuel household paying by direct debit will see the annualised figure increase from £1,663 to £1,723. Gas bills under the cap are expected to rise by approximately 8%.
But the cap does not limit anyone’s total bill. It controls unit rates. A household that uses more energy will still pay more.
At the new national-average rates, standing charges alone will cost a dual-fuel household approximately £308 a year before it has consumed a single unit of gas or electricity. “Ofgem’s October 2026 price-cap announcement” (https://www.ofgem.gov.uk/press-release/energy-price-cap-will-rise-4-october-2026) should therefore be understood for what it is: another increase immediately before the heating season.
There is another detail households should know. Ofgem has revised its definition of “typical” consumption downwards, reflecting around 7% less electricity use and 17% less gas use than under its previous measure. Using the former consumption assumption, Ofgem says the October cap would be £1,935.
That does not mean Ofgem has concealed an additional charge. It means the headline figure now assumes a household consuming substantially less energy. The cap may look lower on paper partly because the “typical” household is assumed to use less.
The debt is already here
Households are not entering this winter with clean balance sheets.
Domestic energy debt has risen above £4.5 billion. Ofgem’s latest published indicators show average arrears of £1,876 for electricity and £1,623 for gas among customers without repayment arrangements—both around 9% higher than a year earlier. “Ofgem’s debt and arrears data” (https://www.ofgem.gov.uk/data/debt-and-arrears-indicators) reveal the depth of the damage accumulating behind closed doors.
The Government’s own fuel-poverty statistics projected that 7.63 million households in England would need to spend more than 10% of their income after housing costs on domestic energy in 2025. Those projections were produced before the latest period of international instability. “The 2026 fuel-poverty report” (https://www.gov.uk/government/statistics/annual-fuel-poverty-statistics-report-2026) therefore already carried a serious warning before this winter’s increase was announced.
This is not simply a temporary inconvenience. It is a question of resilience. Families carrying substantial arrears into winter have no financial shock absorber left.
We must be honest about what is driving the increase
The case against Britain’s present energy strategy must be built on facts.
Ofgem says the immediate October increase is being driven predominantly by higher international gas prices associated with geopolitical instability. It would therefore be wrong to describe every pound of this particular increase as a Net Zero charge.
But that does not absolve government policy.
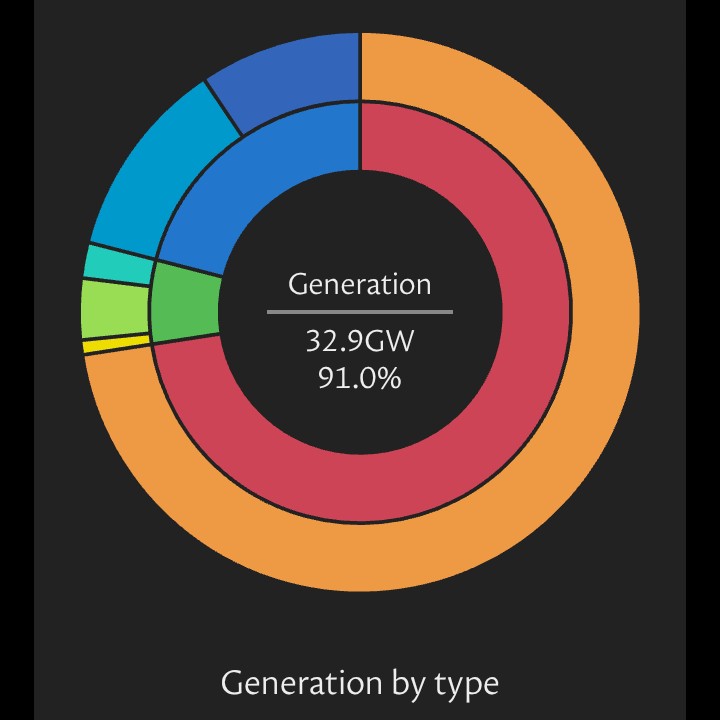
Ofgem’s own breakdown shows that approximately 47% of the October cap relates to wholesale energy, including Contracts for Difference; 24% relates to networks; 6% to policy costs; and 17% to operating costs, debt-related allowances and other industry charges. Network expenditure is not exclusively a Net Zero cost, and Ofgem does not separately identify the renewable-contract element within its wholesale category. Nevertheless, the figures demonstrate how many different costs are already being layered into the household bill. “Ofgem’s official price-cap breakdown” (https://www.ofgem.gov.uk/sites/default/files/2026-08/Summary-of-changes-to-energy-price-cap-1-October-to-31-December-2026.pdf) makes that architecture visible.
The greater scandal is that the Government still does not provide households with one clear, consolidated account showing the incremental cost of the Net Zero transition across energy bills, taxation, infrastructure commitments and consumer prices.
Instead, the costs are fragmented between policy levies, network investment, long-term contracts, public spending, borrowing and the prices charged by businesses trying to recover their own energy and compliance costs.
When costs are scattered across so many accounts, political responsibility becomes difficult to trace. The household still pays—but rarely through a line marked “Net Zero”.
The food crisis never ended
Food inflation has slowed, but that does not mean food has become cheaper.
The distinction is crucial. Falling inflation means prices are rising more slowly. It does not reverse the increases households have already absorbed.
The ONS food and non-alcoholic beverages index stood at 103.5 in January 2021. By July 2026, it had reached 144.4—an increase of approximately 39.5%. Annual food inflation may have fallen to 1.3%, but the underlying price level remains dramatically higher than it was before the steep post-2021 surge. “The latest ONS inflation figures” (https://www.ons.gov.uk/economy/inflationandpriceindices/bulletins/consumerpriceinflation/july2026) confirm that the increase has not been unwound.
Using the ONS household food-and-drink basket of £73.70 a week and linking a constant quantity of goods to the official food index produces a stark illustration. A basket costing approximately £55.56 at January 2021 prices would cost around £77.52 at July 2026 prices.
That is an increase of £21.96 a week—or approximately £1,142 a year—for the same notional quantity of food.
This is an illustrative constant basket, not a claim that every household’s actual spending rose by precisely that amount. Families change what they buy, trade down, abandon branded products and reduce quantities. Those coping mechanisms can prevent expenditure from rising as quickly as prices, but only because living standards are being squeezed.
The burden is also unequal. Government food statistics show that the poorest fifth of households devoted 15.2% of their spending to household food and non-alcoholic drinks in 2025, compared with 7.9% for the richest fifth. “Defra’s food statistics” (https://www.gov.uk/government/statistics/food-statistics-pocketbook/food-statistics-in-your-pocket) demonstrate why even a modest further increase can be devastating for those already on the tightest budgets.
Shrinkflation: paying more and receiving less
The pressure is not always visible on the shelf label.
Major branded products have repeatedly become smaller while prices remained unchanged or increased. Walkers reduced a multipack from 24 bags to 22 while keeping the headline price unchanged. KP reduced packs of peanuts from 250g to 225g. Quality Street fell from 600g to 550g while one tracked supermarket price increased from £6 to £7. A KitKat multipack recorded by Which? fell from 21 bars to 18 while its price rose from £3.60 to £5.50.
For the KitKat example, the effective price per bar rose by more than 78%.
Cadbury Freddo and Fudge multipacks have fallen from five bars to four, while Terry’s Chocolate Orange and Nescafé products have also been reduced in size. “Which?’s shrinkflation investigation” (https://www.which.co.uk/news/article/from-chocolate-to-coffee-the-products-shrinking-as-prices-stay-the-same-a1z3f0F4iXMY) shows how inflation can be disguised through packaging.
These increases must not be added on top of the official 39.5% food-price rise. ONS price statistics generally standardise products by weight or quantity, meaning shrinkflation is already reflected when the affected products enter the index. It is another way in which the same price pressure reaches the consumer—not an entirely separate total.
But it explains why the crisis feels worse than the headline rate suggests. A household may see a familiar price on the shelf and only later discover that it has paid for less food.
Net Zero, farming and the missing account
Net Zero is not the sole cause of food inflation. Defra identifies farmgate prices, import costs, exchange rates, labour and manufacturing expenses among the principal drivers. International commodity disruption also matters.
But energy policy cannot be separated from food prices.
Energy is required to manufacture fertiliser, operate machinery, heat buildings, refrigerate produce, process food, manufacture packaging and transport goods. Costs imposed anywhere along that chain eventually have to be absorbed by farmers, manufacturers, retailers or consumers.
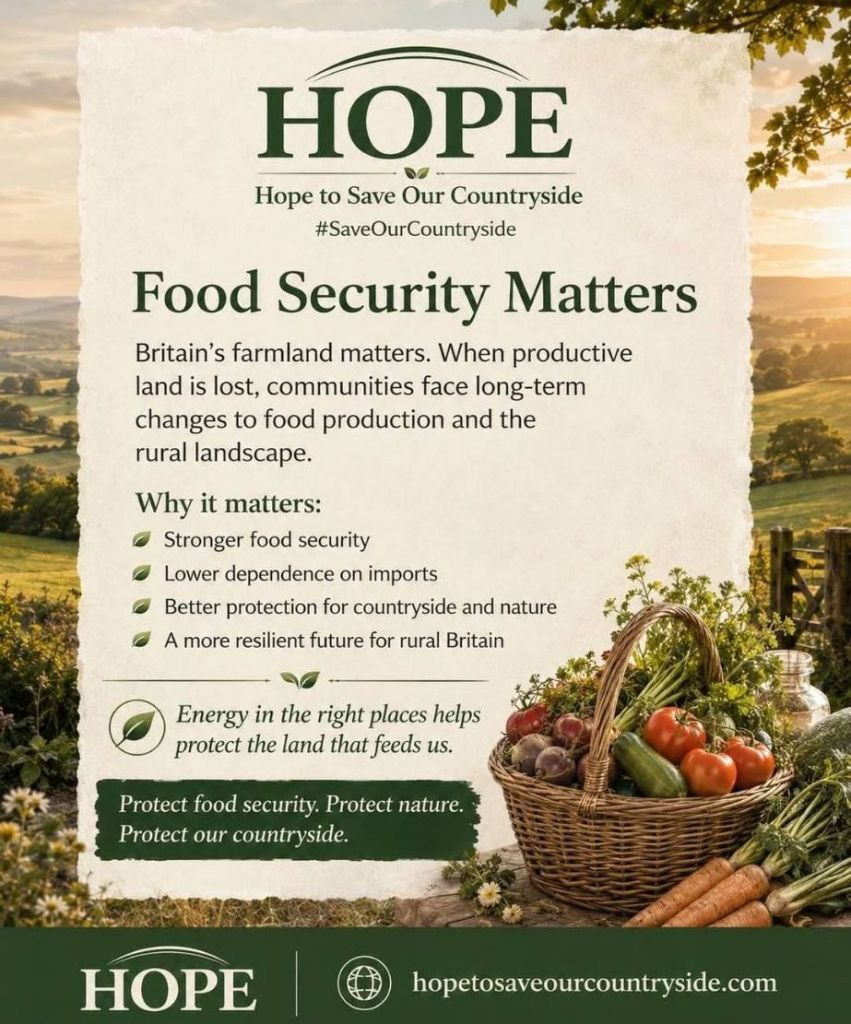
At the same time, productive agricultural land is being targeted for utility-scale solar developments and battery compounds. Every individual development may appear small in national statistics, but the cumulative effect on productive capacity, rural infrastructure and dependence on imported food deserves a transparent national assessment.
It is contradictory to warn about food security while making domestic food production more difficult and potentially less competitive. It is equally contradictory to promise cheap renewable electricity while household bills continue to carry expanding network, balancing, contractual and policy costs that few consumers can identify.
The absence of a fully audited pass-through figure is not permission to invent one. It is a reason to demand that the Government produce it.
What must change
Britain needs a consolidated, independently audited account of Net Zero expenditure and liabilities, clearly separating ordinary system maintenance from additional transition costs. Households should be able to see what they are paying through bills, taxes, borrowing and consumer prices.
Productive farmland should receive much stronger protection. Solar generation should be directed first towards rooftops, car parks, industrial estates, brownfield land and other already-developed surfaces.
Energy security must be treated as an essential public interest. Britain needs reliable domestic generation, a realistic transitional role for domestic gas, accelerated nuclear and small modular reactor deployment, and a grid designed around dependable supply—not permanent emergency intervention.
This winter’s crisis will not be caused by one policy, one conflict or one bill. It is the accumulated result of households being asked to absorb energy volatility, food-price increases, shrinking products, infrastructure expenditure and poorly explained policy costs at the same time.
That is why this winter will be like no other.
The crisis is no longer hidden in distant targets or technical reports. It is visible in the meter, the standing charge, the supermarket trolley and the shrinking packet.
The public can now see it.
The question is whether the Government is prepared to account for it.
Shane Oxer. Campaigner for fairer and affordable energy
 SAY NO TO THE DESTRUCTION OF OUR LAND
Leave a comment