The precise figure is not one convenient number. Government policy points towards 69.4–75 GW of solar by 2035. Depending on whether future projects achieve the government’s preferred land efficiency or resemble existing solar farms, the total ground-mounted footprint could range from approximately 112,000 to 170,000 hectares.
Britain is not being asked to accept a few discreet solar developments.
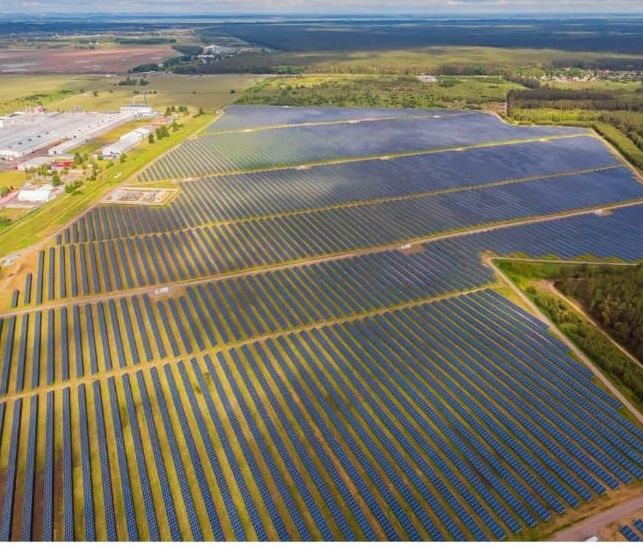
We are witnessing the planned transformation of whole rural districts: solar arrays, perimeter fencing, CCTV, access roads, substations, inverters, transformers, underground cables and, increasingly, adjoining battery-storage compounds.
The government describes this as clean-energy deployment. For the communities expec
ted to live among it, it can mean the industrialisation of farmland and countryside for decades.
The argument has often been obscured by percentages. Ministers say solar could occupy only a tiny proportion of the United Kingdom’s total land area. The government’s Solar Roadmap presents a figure of up to 0.4% of UK land by 2030. But a national percentage spreads the impact mathematically across cities, mountains, roads, airports, forests and every other part of the country—even though large solar projects are concentrated in particular rural districts close to substations and transmission routes.
A village surrounded by solar farms does not experience 0.4% of an impact.
It experiences the development placed around that village.
The figures, precisely
The Clean Power 2030 Connections Reform Annex provides for 69.4 GW of solar capacity across Great Britain by 2035. The later Solar Roadmap presents an illustrative “current-policy high” scenario reaching 75 GW by 2035. The Roadmap is clear that its scenarios are not formal forecasts or binding targets, but they show the scale of development the government believes could arise under favourable policy, grid, finance and supply-chain conditions.
The government’s own Solar Roadmap methodology uses two important land-intensity figures:
5.6 acres per MW as the calculated median footprint of existing operational ground-mounted solar;
4 acres per MW as its assumption for new projects, based on developments recorded in the Renewable Energy Planning Database.
Applying those official assumptions produces the following land stress test:
2035 solar capacity
At 4 acres per MW
At 5.6 acres per MW
69.4 GW
112,341 hectares
157,277 hectares
75 GW
121,406 hectares
169,968 hectares
The calculation behind the upper figure is straightforward:
75,000 MW × 5.6 acres per MW = 420,000 acres, or approximately 169,968 hectares.
That is almost 1,700 square kilometres.
The figures previously described as 156,000 and 168,000 hectares can therefore be stated more accurately as approximately 157,000 hectares under the 69.4 GW scenario and 170,000 hectares under the 75 GW scenario, when the measured median footprint of existing ground-mounted projects is used.
These are not claims that every MW will be ground-mounted. Some capacity will be installed on homes, commercial roofs, warehouses, car parks, contaminated land and other previously developed sites. They are transparent land-use stress tests showing what happens if the national capacity trajectory continues to depend heavily on ground-mounted development.
How much of this would be new development?
The Solar Roadmap used a baseline of approximately 18 GW installed in the first quarter of 2025. From that baseline, reaching 69.4 GW would require another 51.4 GW, while reaching 75 GW would require another 57 GW.
If all that additional capacity were built on the ground using the government’s preferred new-project assumption of four acres per MW, the additional footprint would be approximately:
83,203 hectares to move from 18 GW to 69.4 GW;
92,268 hectares to move from 18 GW to 75 GW.
If new schemes instead remained closer to the measured operational median of 5.6 acres per MW, the additional footprint would rise to between approximately 116,485 and 129,176 hectares.
Again, this is not a prediction that all additional solar will be ground-mounted. It is a warning about the scale of land exposure if the promised rooftop revolution fails to materialise and developers continue to find large rural sites commercially easier to assemble.
More than 70,000 hectares are already visible in the planning pipeline
The strongest evidence does not come from multiplying a national capacity figure by an assumed land ratio.
It comes from the actual planning database.
Our examination of the April 2026 Renewable Energy Planning Database identified 4,646 active solar records across England, Scotland and Wales. Those records contained at least 42.9 GW of stated capacity and 70,868 hectares—175,119 acres—of published site-area evidence.
A further 2,324.5 MW of identified ground-mounted capacity had no usable site-area figure. Applying a central estimate of five acres per MW only to those missing records increased the indicative active-pipeline footprint to approximately 75,572 hectares, or 186,741 acres.
This is not an estimate of what might theoretically happen in 2035.
It is the land already appearing in active planning records as awaiting construction, submitted for approval or under construction.
Nor is the pressure confined to a few enormous nationally significant schemes. The active pipeline contained 617 projects in the 20–49.9 MW range, representing almost 23.9 GW. By comparison, there were 54 projects of 50 MW or more, totalling approximately 13.9 GW.
That distinction matters.
Large projects receive national attention. Smaller schemes are often dealt with separately by local planning authorities. Yet several neighbouring 30 MW, 40 MW and 49.9 MW developments can create a cumulative landscape transformation equal to—or greater than—one nationally significant project.
Every application may be described as limited, temporary and locally manageable. The combined effect can be an energy estate stretching across several parishes.
“Only 0.4%” conceals where the development is going
The government’s 0.4% argument depends on comparing solar land with the entire area of the United Kingdom.
But solar farms are not distributed evenly.
They are attracted to land near grid infrastructure, connection points and areas where developers can assemble large adjoining fields. The government’s own Connections Reform Annex divides the country into regional capacity zones precisely because solar and battery projects are geographically dispersed, nationally oversubscribed and capable of creating inefficient network development if they are not controlled regionally.
For 2035, the annex identifies:
13.7 GW of solar in the “Midlands” transmission region;
9.5 GW in North Wales, the Mersey and the Humber;
9.5 GW in Central England;
8.3 GW in South Wales and the Severn;
7 GW in South-East England.
These are not trivial additions to the landscape.
They point towards concentrated development around strategic grid corridors, not a thin and harmless coating spread uniformly across Britain.
Our planning analysis similarly found the largest active concentration in the East Midlands, with approximately 11.7 GW of stated solar capacity. England accounted for more than 38 GW of the active GB planning total examined.
The national percentage therefore answers the wrong question.
The proper question is:
How much land will be transformed within the particular counties, valleys, villages and grid corridors selected to carry this policy?
A solar farm is not merely a field with panels
Official policy itself demonstrates why describing these developments as simple or unobtrusive is misleading.
The National Policy Statement for renewable energy infrastructure says solar applications are likely to include panel arrays, piling, mounting structures, inverters, cabling, earthworks and site-security measures. They may also include battery storage or hydrogen-related equipment. Projects can require internal access routes, new links to public roads, fencing, CCTV, lighting, overhead or underground cabling and substations.
The same policy recognises that utility-scale solar farms are large sites which may have a significant zone of visual influence. It requires consideration of landscape character, residential amenity, cumulative development, agricultural land, drainage, flood risk, soils, biodiversity, rights of way and glint and glare.
Nor does “temporary” mean brief.
The current National Policy Statement says an upper operational limit of 40 years is typical, while applicants may seek different periods or even consent without a defined time limit. Panels may also be replaced during the operational life of a site.
Forty years is a generation.
A child growing up beside one of these developments may reach middle age before the panels are removed—assuming the consent is not extended or the site repowered.
Agricultural activity does not erase industrialisation
Supporters of ground-mounted solar often argue that sheep may graze beneath panels or that biodiversity management can continue around the arrays.
Some sites may retain limited grazing, and well-designed schemes may provide ecological improvements compared with intensively cultivated land. That should be acknowledged.
But it does not remove the physical development.
A fenced electricity-generating station containing arrays, piles, inverters, transformers, cameras, access tracks and cabling is not equivalent to an open agricultural landscape. Its primary purpose has changed from agriculture to electricity generation.
The National Policy Statement itself recognises that projects at this scale are likely to use agricultural land. It says previously developed, brownfield, contaminated and industrial sites should be used where possible, and that poorer-quality agricultural land should be preferred where agricultural land is necessary. Best and Most Versatile land is not prohibited, but its economic and agricultural benefits must be considered.
GOV.UK
That is a planning balance , not a guarantee of protection.
Once multiple applications are presented as nationally necessary infrastructure, the claimed need for renewable capacity can progressively outweigh the local agricultural, landscape and community harm.
The grid registers reveal an even larger problem
The planning pipeline is only one layer.
Our examination of the Existing Agreements Register, Transmission Entry Capacity Register and Transmission Works Register demonstrates that Britain does not suffer from a shortage of solar proposals. It suffers from an enormous, oversubscribed and technically dependent project pipeline.
The evidence identified:
1,135 solar entries in the Existing Agreements Register, with a raw listed capacity of almost 93 GW;
approximately 64 GW of those entries carrying connection dates after 2030;
618 solar-associated TEC records, although most were hybrid or multi-technology projects rather than pure solar;
577 directly solar-linked TWR rows, covering 97 project numbers and 359 identifiable transmission-work items.
These datasets must not be added together. They record different stages and types of evidence.
The planning database shows proposed sites. The Existing Agreements Register shows agreement and Gate 2 application signals. TEC records contracted connection capacity. TWR identifies transmission works associated with connection agreements.
Together, however, they reveal a central truth:
The countryside is being placed under planning pressure faster than the physical network can necessarily accommodate the resulting generation.
The government itself acknowledges that a prioritised connection offer does not guarantee that a project will be completed or energised. Projects must still obtain consent, satisfy progression milestones and depend on the necessary physical system being delivered.
GOV.UK
In April 2026, DESNZ and Ofgem reported that 221 GW of projects considered unnecessary for 2035 or no longer progressing had been moved out of the main connections queue. That may improve queue management, but an administrative reordering does not build substations, transformers, circuits, switchgear or cables.
Our wider TWR analysis found thousands of reinforcement dependencies extending through the 2030s. The evidence points not to a completed grid ready for Clean Power 2030, but to a prolonged national reconstruction programme continuing well beyond the political target date.
That raises a legitimate public-interest question:
Why should farmland be consented, fenced and taken into an energy-development pipeline before the government can demonstrate when the necessary physical connection works will actually be completed?
Rooftops first should become a binding rule
This debate should not be reduced to being “for” or “against” solar power.
Solar has a legitimate role on homes, warehouses, factories, schools, hospitals, car parks, transport depots, contaminated sites and suitable brownfield land.
The objection is to a policy system that praises rooftop solar while allowing the easier commercial route—vast ground-mounted development—to dominate the planning pipeline.
A credible countryside-protection policy should require five changes.
First, rooftop and brownfield alternatives must be demonstrated, not merely mentioned. Developers seeking hundreds or thousands of acres should have to show why suitable commercial, public-sector and previously developed land cannot provide the capacity.
Second, no major solar consent should be granted without a transparent grid-deliverability statement. It should identify the connection point, contracted date, TWR dependencies, shared reinforcements and the earliest realistic energisation date.
Third, planning authorities must assess cumulative regional development. Each project cannot continue to be treated as though neighbouring solar farms, batteries, substations and cable corridors do not exist.
Fourth, Best and Most Versatile agricultural land, flood-sensitive land, peat and protected landscapes need a stronger presumption against development. “Temporary” use for 40 years does not preserve the countryside experienced by the present generation.
Fifth, the government should publish a national solar land budget. It should distinguish rooftops, brownfield, car parks, contaminated land, lower-grade farmland and Best and Most Versatile land, with project-level reporting rather than vague national percentages.
The countryside is not an empty space on an energy map
The government sees capacity zones, gigawatts and connection corridors.
Communities see fields, footpaths, hedgerows, views, wildlife, drainage systems, farms and the landscape around their homes.
Those are not sentimental obstacles to progress. They are national assets.
The precise land figure depends on how much solar is placed on rooftops and how efficiently future ground-mounted projects use land. But the credible range is now clear.
At the government’s optimistic new-build assumption, a fully ground-mounted 69.4–75 GW system would occupy approximately 112,000–121,000 hectares.
At the measured median footprint of existing operational projects, the figure rises to approximately 157,000–170,000 hectares.
Meanwhile, the active planning pipeline already identifies more than 70,000 hectares, with a central evidence estimate exceeding 75,500 hectares once missing ground-mounted site areas are included.
This is not a handful of isolated applications.
It is a national land-use transformation.
Britain should not have to choose between energy security and the countryside. We can prioritise rooftops, commercial buildings, car parks, brownfield land, domestic innovation and reliable firm generation. We can rebuild the grid before overloading planning systems with projects whose connections remain dependent on works extending into the 2030s.
What we must not do is pretend that hundreds of thousands of acres of panels, fencing, substations, batteries, cables and access roads amount to no more than an insignificant percentage on a government spreadsheet.
Once the countryside is enclosed and industrialised, the impact is real , whatever percentage ministers choose to place beside it.
Shane Oxer — Campaigner for fairer and affordable energy
 SAY NO TO THE DESTRUCTION OF OUR LAND
Leave a comment