
Kent, Suffolk and Essex expose the fragmented accounting behind
Britain’s energy build-out
By Shane Oxer — Campaigner for fairer and affordable
energy
Across Kent, Suffolk and Essex, one of the largest concentrations of
new electricity infrastructure in Britain is taking shape.
Offshore wind farms measured in gigawatts. Vast solar developments.
Battery-storage compounds. New substations. Converter stations.
Interconnectors crossing the North Sea. New 400kV transmission corridors
carrying electricity inland.
Viewed individually, they appear as separate projects. Viewed
electrically, they form an increasingly interconnected energy corridor
stretching from the North Sea through Suffolk and Essex to Kent and
onward into the national transmission system.
Viewed financially, the scale is even more striking.
Published documents already reveal approximately £19.8 billion to
£21.9 billion of project values associated with a relatively small
selection of major schemes affecting these three counties.
That is not presented here as an audited regional total. The projects
are at different stages, the figures use different price bases, and some
are whole-project estimates while others are regulatory allowances or
historic estimates. What the figure does establish is that tens of
billions of pounds are already visible before the regional account is
complete.
The money is spread across developer funding statements, Ofgem
determinations, National Grid investment plans, planning examinations
and local authority energy strategies. The physical electricity system
is integrated. The financial evidence is fragmented.
Kent, Suffolk and Essex provide a powerful case study of the question
now being asked nationally: before Britain commits still more capital,
where is the single account showing what the complete system
requires?
£20 BILLION — BEFORE THE ACCOUNT IS COMPLETE
Start offshore. North Falls Offshore Wind Farm carries a current
project estimate of between £2.5 billion and £4.5 billion. The
applicant’s Funding Statement says that range includes construction,
operational and development costs, project management, financing, land
acquisition and compensation. [Source:
North Falls Funding Statement]
Five Estuaries adds approximately £3.5 billion. The figure appears in
the Examining Authority’s recommendation report as the proposed
development’s current estimated cost. [Source:
Five Estuaries Recommendation Report]
ScottishPower describes East Anglia THREE as a £4 billion project. By
August 2026 all 95 offshore foundations had been installed off the
Suffolk coast. East Anglia TWO is another £4 billion development. Taken
together, those two projects alone represent around £8 billion of
published investment. [Source:
ScottishPower Renewables]
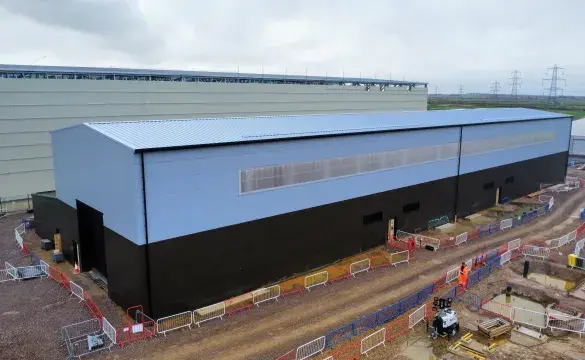
NeuConnect, the 1.4GW electricity interconnector being built between
Britain and Germany, adds another £2.4 billion. On the British side its
converter station is being constructed on the Isle of Grain in Kent,
linked to Germany through more than 700 kilometres of land and subsea
cable. [Source:
NeuConnect]
Sunnica Energy Farm was examined using an estimated scheme cost of
around £600 million. Longfield Solar Farm’s Funding Statement identified
a cost range of £450 million to £550 million. Cleve Hill Solar Park was
examined on an estimated project cost of about £450 million. Stonestreet
Green Solar states construction costs of approximately £150 million,
excluding decommissioning. [Source:
Planning Inspectorate — Longfield]
Bramford to Twinstead introduces another network cost. Ofgem’s
January 2026 project assessment proposed an allowance of £642.2 million
in 2024/25 prices, comprising £482.2 million of direct construction
costs and around £160 million of other direct, indirect and risk costs.
[Source:
Ofgem — Bramford to Twinstead]
Then there is Sea Link. National Grid’s public funding material has
carried an estimate of roughly £1.1 billion in the older 2018/19 price
base. Ofgem has since approved Early Construction Funding equal to 27%
of the updated total project cost, confirming that the contemporary
figure has moved beyond the historic baseline. [Source:
Ofgem — Sea Link Early Construction Funding]
Placed together, these published values produce a visible scale of
roughly £19.8 billion to £21.9 billion. But some of the largest emerging
projects in the same geography still sit outside that screen.
KENT — FROM ROMNEY MARSH TO THE ISLE OF GRAIN
Kent makes the financial scale physical.
Cleve Hill Solar Park is now operational on the north Kent coast. Its
373MW development contains more than 550,000 photovoltaic modules
together with energy-storage and associated electrical infrastructure.
[Source: Cleve Hill Solar
Park]

Further south, the concentration around Romney Marsh is larger
again.
South Brooks proposes a 500MW solar-and-battery development around
Lydd. The current project envelope covers 1,208 hectares — almost 3,000
acres — although the council records that not all of that land would
contain panels. The latest plans identify around 655 hectares of
above-ground development, with additional land for landscaping, ecology,
battery storage and substations. [Source:
Folkestone & Hythe District Council — South Brooks]
South Kent Energy Park proposes another 500MW of solar generation
with on-site battery storage across approximately 600 hectares of
agricultural land, connecting through the transmission network at
Dungeness or a new nearby substation. [Source:
Folkestone & Hythe District Council — South Kent]
Shepway Energy Park adds a further nationally significant
solar-and-storage proposal. The current project area is approximately
406 hectares. Together, the major Romney Marsh schemes amount to around
1.2GW of proposed solar generation in one part of Kent before smaller
local applications are counted. [Source:
Folkestone & Hythe District Council — Shepway]
Their complete comparable funding figures are not yet part of the
£19.8–£21.9 billion screen. Their capacity and land requirement are
visible long before their final whole-scheme costs can be placed beside
the older projects.
At the opposite end of the county, the Isle of Grain is becoming a
different kind of energy hub. NeuConnect’s converter buildings,
transformers and connection infrastructure are now physically rising
beside the existing industrial and electricity complex. All fourteen
project transformers — seven in Britain and seven in Germany — had been
delivered by May 2026. By July, more than 350 kilometres of the cable
programme had been laid. [Source:
NeuConnect construction milestones]

National Grid is simultaneously constructing the new 400kV Wallend
substation. The company states that the substation will facilitate
NeuConnect and forms part of its £2.7 billion South East investment
programme. National Grid’s own investment case also identifies Wallend
as infrastructure capable of facilitating further large connections,
including another interconnector and a 249MW BESS. [Source:
National Grid — Wallend Substation]
Sea Link would add another 2GW HVDC corridor between Suffolk and
Kent, with converter stations, around 122 kilometres of offshore cable,
onshore cable systems and the new Minster substation. Ofgem says the
project is intended to increase transfer capability between East Anglia
and the South East and reduce system constraints. [Source:
Ofgem — Sea Link Project Assessment]
NESO’s assessment, quoted by Ofgem, places the potential consequence
of Sea Link not being available in 2030 at £1.1 billion to £1.4 billion
of annual constraint costs. That is not a construction-cost estimate. It
is a measure of how expensive the wider system can become when the
network and generation programme do not arrive in sequence. [Source:
Ofgem — Sea Link acceleration]
SUFFOLK — £8 BILLION OFFSHORE BEFORE SOLAR AND GRID
Suffolk reveals another layer of the same transformation.
East Anglia THREE and East Anglia TWO represent around £8 billion of
published project investment between them. Their turbines stand
offshore, but their electrical system reaches deep into Suffolk through
landfall works, high-voltage cable corridors, converter and substation
infrastructure and new National Grid connections.

Around Friston and the Suffolk coast, multiple pieces of
infrastructure increasingly share the same geography. ScottishPower’s
onshore works include cable routes and substation platforms associated
with East Anglia projects, while National Grid infrastructure is being
developed to receive and move the power onwards.
Sunnica adds a large solar-and-storage component. Suffolk County
Council describes the consented scheme as approximately 630MW, spread
across West Suffolk and East Cambridgeshire, with associated BESS and
national-grid infrastructure. [Source:
Suffolk County Council — Sunnica]
EcoPower Suffolk proposes another 250MW solar farm with BESS around
the Yaxley 400kV substation. Suffolk County Council currently records a
project area of approximately 600 hectares. Helios Energy Park proposes
another 250MW solar-and-storage scheme near Friston with a connection
offer at the Friston 400kV node. [Source:
Suffolk County Council — EcoPower]
Below the NSIP threshold sits another layer of ordinary solar
applications. Suffolk’s own infrastructure papers have listed multiple
schemes clustered in the 40–49MW range. One project at a time, these
developments can appear modest beside a £4 billion offshore wind farm.
In aggregate they add hundreds of megawatts to the same regional
network. [Source:
Suffolk Local Authority Forum papers]
This is why the regional cost cannot be understood by looking only at
the headline NSIPs. The offshore farms, solar projects, battery sites,
substations and transmission routes are separate planning cases, but
they meet inside the same electricity system.
ESSEX — 1.47GW OF SOLAR AND 935MW OF BATTERIES IN THE PIPELINE
Essex County Council’s own 2026 Local Area Energy Plan provides one
of the clearest cumulative snapshots anywhere in the region.
It records 459MW of existing ground-mounted solar and another 1,471MW
in the pipeline. It also records 233MW of existing battery storage and
another 935MW in the pipeline. [Source:
Greater Essex Local Area Energy Plan]
Those numbers change the scale of the discussion. The Essex
ground-mounted solar pipeline alone is approaching 1.5GW. The battery
pipeline is approaching another gigawatt.
Longfield Solar Farm is only one part of that picture. Its
examination identified a scheme estimate of £450 million to £550
million, including the compulsory-acquisition element. The wider Essex
pipeline is much larger than Longfield alone. [Source:
Planning Inspectorate — Longfield]
At the same time, offshore wind adds another multi-billion-pound
layer. North Falls carries a published estimate of £2.5 billion to £4.5
billion. Five Estuaries carries a current estimated project cost of
around £3.5 billion. Together, two offshore schemes produce £6 billion
to £8 billion of project value before the rest of Essex’s local
generation and storage pipeline is priced.
The whole offshore-project cost is not expenditure within Essex
itself. But Essex is where cables make landfall, where substations
receive the power and where transmission reinforcement has to move it
onwards. The financial boundary of the developer and the electrical
boundary of the system are not the same thing.
That is one reason the full bill is so difficult for the public to
see. A wind farm is costed in one place. The onshore connection is
assessed elsewhere. National Grid expenditure appears through Ofgem.
Distribution reinforcement is funded under another price-control regime.
Local authorities model their own local energy pathways. All of those
pieces ultimately meet in the physical system.
£12.3 BILLION — THE TRANSMISSION PROGRAMME BEHIND THE PROJECTS
National Grid’s own regional investment plans show the size of the
network programme supporting this build-out.
For the wider East Anglia electrical region, National Grid identifies
£9.6 billion of investment to maintain, upgrade and develop the
transmission network. It expects 12.6GW of new low-carbon generation to
connect, including around 10GW of offshore wind, 1.2GW of hybrid battery
projects and 1.1GW of battery storage. The programme includes eight new
substations and major projects such as Norwich to Tilbury, Bramford to
Twinstead, Eastern Green Links 3 and 4, Grimsby to Walpole and Sea Link.
[Source:
National Grid RIIO-T3 — East Anglia]
For the wider South East electrical region, National Grid identifies
another £2.7 billion. It includes five new substations and connections
associated with interconnectors and battery storage, including the Isle
of Grain and Minster area. [Source:
National Grid RIIO-T3 — South East]
Together, those two regional transmission programmes amount to £12.3
billion.
They are not a second clean £12.3 billion to place on top of the
project screen: the regions extend beyond Kent, Suffolk and Essex, and
some individually identified projects sit inside those investment
programmes. Instead, the figure demonstrates the scale of the regulated
transmission system being built alongside the generation, storage and
interconnector projects.
Norwich to Tilbury provides the clearest example of the overlap. Its
whole-route cost analogue of approximately £2.2239 billion was examined
in our Norfolk investigation. The same project continues through Suffolk
and Essex and remains essential to understanding the electrical
geography here. Its cost has therefore not been repeated as a new
regional discovery.
The accounting problem is now visible. Generation is financed and
reported through project companies. Transmission is funded through
regulated network allowances. Interconnectors operate under their own
regulatory arrangements. Local generation appears in planning registers.
Constraint costs emerge later through system operation. The same
electricity system is being described through multiple financial
ledgers.
THE MONEY IS VISIBLE. THE COMPLETE ACCOUNT IS NOT.
The £19.8–£21.9 billion identified here is not the final cost of the
energy transformation in Kent, Suffolk and Essex.
It is the visible floor produced by a limited group of major schemes
for which usable published values can already be found.
The three large Romney Marsh projects are not yet represented by
comparable whole-scheme costs. EcoPower and Helios are not represented
by comparable final funding figures. Further interconnector and network
projects remain outside the screen. Numerous smaller solar and battery
schemes are not individually priced. Distribution-network reinforcement
is accounted for elsewhere. Financing and decommissioning are treated
differently from project to project.
At the same time, National Grid is planning £12.3 billion across the
wider East Anglia and South East transmission regions, with overlaps
that have to be reconciled before any meaningful cumulative total can be
produced.
The conclusion is therefore not that one neat £20 billion bill has
been discovered.
The conclusion is that approximately £20 billion can already be
identified from a relatively small part of the programme before the
complete ledger has been assembled.
That is a fundamentally different finding — and a more important
one.
WHERE IS THE NATIONAL ACCOUNT?
Petition 780321 asks for an independent national assessment of the
full costs and impacts associated with the UK’s statutory carbon budgets
and 2050 Net Zero framework.
The evidence from Kent, Suffolk and Essex cannot by itself answer
that national question. It demonstrates why the question exists.
What is the complete capital requirement of the chosen electricity
system? What is the financing cost across the lifetime of the assets?
How much transmission and distribution reinforcement is required? How
much storage? What are the costs when generation and network delivery
fall out of sequence? What will replacement and decommissioning cost?
And through which routes will those costs ultimately be recovered from
households and businesses?
Most importantly, where is the single document that reconciles those
categories without counting the same infrastructure twice?
The infrastructure is already becoming physical. Cleve Hill is
operating. NeuConnect’s converter station is rising on the Isle of
Grain. East Anglia THREE is under construction. New substations and
transmission corridors are moving through the planning and delivery
system. Essex already records gigawatts of solar and battery capacity in
its pipeline.
The photographs show the steel, concrete, transformers, cable routes
and solar arrays. The financial documents show billions of pounds being
committed.
What remains difficult to see is the complete account.
£20 billion is not the complete bill.
It is what can already be found in part of one region.
Before Britain commits hundreds of billions more across the country,
Parliament should be able to see the whole system, the whole cost and
the assumptions on which it rests.
That is the evidence the public is entitled to examine.
Shane Oxer — Campaigner for fairer and affordable
energy
HYPERLINKED REFERENCES
1. North
Falls Offshore Wind Farm — Funding Statement
2. Five
Estuaries Offshore Wind Farm — Examining Authority Recommendation
Report
3. ScottishPower
Renewables — East Anglia offshore wind projects
4. NeuConnect
— July 2026 construction and cabling update
5. Ofgem
— Sea Link Project Assessment, September 2026
6. Ofgem
— Sea Link Early Construction Funding decision
7. Ofgem
— Bramford to Twinstead Project Assessment
8. Folkestone
& Hythe District Council — South Brooks Solar Farm
9. Folkestone
& Hythe District Council — South Kent Energy Park
10. Folkestone
& Hythe District Council — Shepway Energy Park
11. Cleve Hill Solar
Park — official project site
12. National
Grid — Wallend Substation, Isle of Grain
13. Suffolk
County Council — Nationally Significant Infrastructure
Projects
14. Suffolk
County Council — EcoPower Suffolk
15. Greater
Essex Local Area Energy Plan 2026
16. Planning
Inspectorate — Longfield Solar Farm funding evidence
17. Planning
Inspectorate — Stonestreet Green Solar funding evidence
18. National
Grid RIIO-T3 regional reports — East Anglia and South East
Leave a Reply