
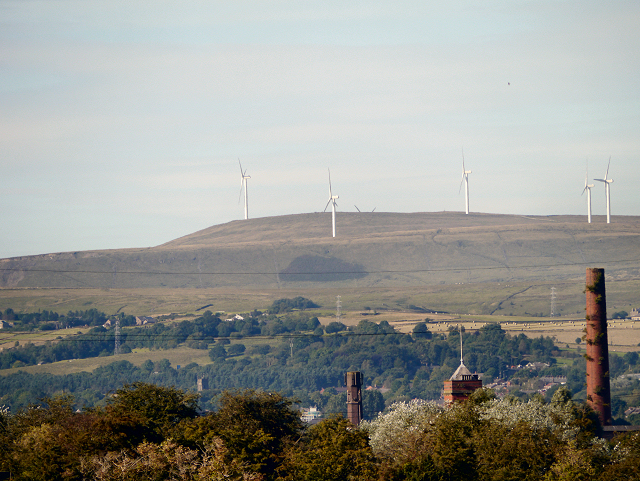
Three proposed wind developments. Sixty-nine turbines. More than 4,300 hectares inside their combined site boundaries. At least 656,000 cubic metres of peat identified for excavation at two of the sites alone.
And still no single public account showing the complete cost, complete land impact and complete grid infrastructure required to make them work.
I call them the Three Peaks:
- Scout Moor II, above Rochdale, Rossendale and Bacup;
- Calderdale Energy Park, across Walshaw Moor;
- Hope Moor, between Barnard Castle and Richmond.
On planning portals they appear as separate schemes. On the ground they follow the same model: giant turbines across upland peat, supported by foundations, roads, crane hardstandings, borrow pits, construction compounds, substations, cables, drainage works and highway alterations.
The turbines are the visible part.
The industrial system beneath them is the part the public is rarely shown in one complete picture.

The numbers the brochures do not put together
The developers’ current documents give a combined headline capacity of approximately 474MW.
That sounds enormous.
But capacity is the maximum output under suitable conditions. It is not the amount of electricity supplied continuously.
Using the developers’ own annual-energy figures, the three projects would generate approximately 1.416 terawatt-hours a year. Divide that by the 8,760 hours in a year and the combined average output is about 161.6MW.
| Project | Turbines | Headline capacity | Forecast annual output | Average output implied |
|---|---|---|---|---|
| Scout Moor II | 12 | At least 68.4MW | 228,289MWh | 26.1MW |
| Calderdale Energy Park | 34 | About 240MW | 733,312MWh | 83.7MW |
| Hope Moor | 23 | Up to 165.6MW | 454,055MWh | 51.8MW |
| Total | 69 | About 474MW | 1,415,656MWh | 161.6MW |
That is an implied combined load factor of roughly 34 per cent.
And even 161.6MW is only an annual average. It is not firm power. On a still day the output can be far lower; at other times it can be higher. The grid must be able to manage both.
That is the first reality: 474MW on the nameplate does not mean 474MW available whenever homes, hospitals and industry require it.
Peak One: Scout Moor II
The revised Scout Moor II scheme proposes 12 turbines up to 180 metres high, with an installed capacity of at least 68.4MW.
Its own planning statement forecasts 9,131,564MWh over a 40-year life. That works out at approximately 228,289MWh a year — or an average output of about 26MW.
Now look at what is required on the ground.
- A site boundary covering 1,023.34 hectares;
- approximately 15.1 kilometres of new or upgraded internal tracks;
- turbine foundations typically 25 metres wide;
- cranes of up to 1,000 tonnes;
- a total crane-pad and clearance area of 7,093 square metres for each turbine;
- an estimated 96,674 cubic metres of peat excavated;
- an onsite substation and an underground 132kV export connection.
The developer proposes to reuse or restore the excavated peat. That is relevant mitigation. But “reused” does not mean “never disturbed”. Peat still has to be excavated, moved, stored and placed elsewhere while roads, foundations and hardstandings are constructed.
The grid story is also more complicated than a single reassuring sentence.
The intended connection is Rossendale Bulk Supply Point. The revised documents identify alternative underground cable routes of approximately 7.9 to 9.8 kilometres, but state that the final route is not yet known.
Cubico says it secured a connection offer. Yet when the National Energy System Operator was asked to confirm the project’s status, it said only that a Gate 2 application had been made. It would not disclose the outcome and explained that the agreement would be held by Electricity North West.
So the public can see the developer’s claim. It cannot see one fully reconciled public record confirming the complete position.
Read the revised Scout Moor II planning material
Read NESO’s Scout Moor grid-information response
Peak Two: Calderdale Energy Park

Calderdale Energy Park is the largest of the three proposals: 34 turbines, of which 32 could reach 200 metres and two could reach 150 metres, with an expected export capacity of approximately 240MW.
The developer’s environmental report uses annual generation of 733,312MWh. That equals an average output of about 83.7MW.
The main turbine area covers approximately 2,227 hectares. That figure does not include every offsite consequence.
The current documents identify:
- foundations likely to be at least four metres deep;
- main crane hardstandings and associated working areas of up to approximately 5,000 square metres per turbine;
- a total earthworks footprint of approximately 510,000 square metres — 51 hectares — within the turbine area;
- five borrow pits, construction compounds and a concrete-batching plant;
- a large onsite substation platform, internal roads, watercourse crossings and underground cables;
- approximately 559,645 cubic metres of peat excavation, including 387,057 cubic metres classed as permanent excavation.
The developer says all excavated peat can be reinstated or reused. But almost 100,000 cubic metres would be allocated to a dedicated peat-storage area — a method its own plan describes as the least preferred option.
The preliminary hydrology assessment also identifies around 71 potential peat-slide source zones and 14 potential bog-burst source zones overlapping areas of moderate likelihood. It says significant operational effects on groundwater flows, private water supplies and peat require additional mitigation.
This is not simply a row of turbines.
It is a civil-engineering project across a water-holding upland landscape.
The missing peat beneath the cable route
Calderdale’s preferred grid connection is Bradford West Substation. The project says it has been awarded a Gate 2 Phase 2 priority slot with a firm connection date by 2031.
But the route and design are not complete.
Most importantly, the outline peat plan states that peat volumes along the access routes and Bradford West cable corridor were not included in its excavation calculation because the necessary peat data had not yet been obtained.
The first approximately 2.5 kilometres of that cable corridor lie within the South Pennine Moors Special Area of Conservation and Site of Special Scientific Interest.
In other words, the headline peat figure is already enormous — and it does not yet cover the whole scheme.
Read Calderdale Energy Park’s current project and grid answers
Read the outline peat-management plan
Read the hydrology and peat assessment
Peak Three: Hope Moor

Hope Moor proposes 23 turbines up to 200 metres high across a scoping boundary of approximately 1,111 hectares.
At 7.2MW each, the current design has a possible installed capacity of 165.6MW. The developer forecasts annual output of 454,055MWh — an average of about 51.8MW and an implied load factor of 31.3 per cent.
The scoping report assumes:
- reinforced-concrete foundations up to 25 metres in diameter;
- permanent crane pads of up to 4,150 square metres per turbine — up to 9.5 hectares across the site;
- temporary blade-laydown areas of up to 2,050 square metres per turbine;
- borrow pits, compounds, access roads, substations and watercourse crossings;
- peat recorded at depths of up to 4.91 metres.
The total road length has not yet been provided. In its formal scoping response, the North Pennines National Landscape team said comparable projects suggested 22 to 28 kilometres of internal roads and demanded the actual permanent length, floating-road length, cut-and-fill length and hardstanding area.
That is the consultees’ estimate, not a final developer figure. The absence of a final figure is precisely the point.

The grid connection that is not in the application
Hope Moor provides the clearest example of the missing-infrastructure problem.
Its own scoping report states that:
- the grid point of connection is not confirmed;
- the location of the off-site substation is unknown;
- the export-cable route cannot yet be identified;
- the project-specific export connection is not included in the proposed development-consent application.
The developer’s position is that the grid works can be assessed and consented separately later.
Legally, that may be possible.
But environmentally and financially, electricity does not leave a wind farm by legal argument. It leaves through physical cables, substations and network capacity.
A consent process that presents the turbines while postponing the route needed to carry their electricity is presenting only part of the real-world project.
Read Hope Moor’s official scoping report
Read the North Pennines National Landscape response
More than 656,000 cubic metres of peat — before Hope Moor is counted
Scout Moor II identifies approximately 96,674 cubic metres of peat excavation.
Calderdale Energy Park identifies approximately 559,645 cubic metres.
Together, that is 656,319 cubic metres.
It still excludes Calderdale’s unsurveyed access and export-cable areas.
And it excludes Hope Moor, where a complete peat-excavation volume has not yet been published.
Developers emphasise peat reuse, habitat management and restoration. Those commitments must be scrutinised fairly. But moving peat is not the same as leaving a functioning peat body undisturbed. Roads and hardstandings also change drainage, fragment habitat and remain in place for decades.
The public deserves both sides of the environmental account: the carbon claimed to be avoided by generation and the carbon, water and habitat consequences of construction.
What might the Three Peaks cost?
The developers have not published one comparable construction price for all three schemes.
So I applied the Government’s own independent benchmark.
A 2025 report commissioned by the Department for Energy Security and Net Zero from Arup gives onshore-wind capital assumptions, in 2023 prices, ranging from approximately £1,241 to £2,205 per kilowatt. Its central figure is £1,588 per kilowatt.
Applied to the Three Peaks’ combined 474MW, that produces:
- Low benchmark: approximately £588 million;
- Central benchmark: approximately £753 million;
- High benchmark: approximately £1.045 billion.
This is a benchmark estimate, not a disclosed developer budget.
The benchmark includes turbines, foundations, site preparation and local connection infrastructure. It does not provide the public with a project-by-project account of all wider network reinforcement, financing, balancing, backup, long-term network charges, maintenance or full landscape restoration.
Read the Government-commissioned cost report
A revealing scale comparison
The combined headline capacity of these three wind developments — approximately 474MW — is almost identical to the stated 470MWe output of the proposed Rolls-Royce small modular reactor design.
But the SMR design target is a capacity factor above 95 per cent. At 95 per cent, 470MW would produce approximately 3.91TWh a year.
The Three Peaks developers forecast approximately 1.416TWh a year.
That means a 470MW generator operating at 95 per cent would produce roughly 2.8 times as much annual electricity as the three wind schemes combined.
This is not a claim that an unbuilt SMR is a like-for-like substitute on cost, construction time or planning. It is a scale check. It shows why maximum capacity must never be confused with energy actually produced.
Read the Rolls-Royce SMR design figures
Three planning files. One unanswered national question.
Scout Moor has a named substation, but the final cable route is undecided and the public Gate 2 outcome has not been disclosed by NESO.
Calderdale has a priority grid slot, but its cable design is not final and its current peat calculation excludes the access routes and export corridor.
Hope Moor does not yet have a confirmed connection point, off-site substation or cable route — and those works are outside the proposed application.
Each statement can be defended individually.
Together they expose the failure.
Britain is permitting generation schemes through fragmented processes while no public body presents the complete physical and financial system in one place.
No single document tells the public:
- the final land disturbed across all three sites and their connections;
- the complete volume of peat affected;
- the complete length of roads and export cables;
- the upstream grid reinforcement triggered or accelerated;
- the full capital, financing, balancing, backup and decommissioning cost;
- the dependable electricity contribution when wind output is low.
That is why this is not simply a local planning argument.
It is a national accountability failure.
MAKE THEM SHOW THE EVIDENCE
My Parliamentary petition asks Parliament to suspend Climate Change Act targets and undertake a full independent national impact assessment of the statutory programme.
Not another promotional summary.
Not another project considered in isolation.
A complete account of cost, land, grid infrastructure, energy security, industry, farming, bills, environmental consequences and alternatives.
If 69 turbines can advance across three great upland landscapes before the public has one reconciled account of the roads, peat, grid and total cost, then the planning system is examining the pieces while Parliament avoids responsibility for the whole.
Please sign it. Then share this investigation with people living across Lancashire, Greater Manchester, Calderdale, County Durham and North Yorkshire.
Whatever your view of wind power or Net Zero, Britain deserves to see the complete evidence before more of its countryside is committed.
Shane Oxer
Campaigner for fairer and affordable energy
Evidence and calculation notes
Figures are based on the current published proposals available on 26 September 2026 and may change as designs develop. Site-boundary areas are not the same as the area directly covered by infrastructure. Average output is calculated by dividing each developer’s forecast annual generation by 8,760 hours; it is not a claim of firm capacity. Cost estimates apply the DESNZ/Arup low, central and high onshore-wind capital assumptions to approximately 474MW and are not developer-disclosed budgets.
- Scout Moor II — revised planning application and Further Environmental Information.
- NESO response FOI/25/197 — Scout Moor connection information.
- Calderdale Energy Park — current design and grid FAQ.
- Calderdale Energy Park PEIR Chapter 4 — Proposed Development.
- Calderdale Energy Park — Outline Peat Management Plan.
- Calderdale Energy Park PEIR Chapter 10 — Hydrology, Hydrogeology, Geology and Soils.
- Calderdale Energy Park PEIR Chapter 11 — Carbon and Climate Change.
- Hope Moor Wind Farm — EIA Scoping Report.
- North Pennines National Landscape — Hope Moor scoping response.
- DESNZ/Arup — Onshore wind and solar cost and technical assumptions.
- Rolls-Royce SMR — published design output and capacity-factor figures.
Scout Moor photograph: © David Dixon, Geograph, CC BY-SA 2.0. Barningham Moor photograph: © David Robinson, Geograph, CC BY-SA 2.0. Walshaw Moor photograph: Shane Oxer.
Leave a Reply